Permission is granted for unrestricted use of these images.
- Clouds are among the most difficult components of the Earth’s climate system to model. They typically vary on a scale that is not captured in today’s climate models and are one of the major contributors to the uncertainty in climate predictions. Mathematicians are using techniques from advanced geometry to characterize clouds and provide a more quantitative description of their role in the climate system.
- As climate change leads to higher sea surface temperatures, the environment in which tropical storms develop changes. The regions where tropical storms form expand, and their frequency, intensity, and duration increase.
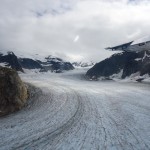
- Glaciers and ice caps adapt to a changing climate much more rapidly than does a large ice sheet. Their extent provides information about the climate in remote areas where no direct climate records are available. They contribute to sea level changes and affect the fresh water availability in many mountains and surrounding regions. This picture shows the LeConte Glacier in Alaska in September, 2011.
- A tipping point is a point where a complex system, like the Earth’s climate system, transits from one equilibrium state to another. In other words, where seemingly small causes have large and sudden effects. Predicting the approach of a tipping point from past observations is one of the most urgent challenges for the mathematical sciences.
- Climate change is one of the most fundamental challenges ever to confront humanity. Its adverse impacts are already being seen and will intensify over time. Decisively dealing now with climate change is key to ensuring sustainable development, eradicating poverty and safeguarding economic growth.
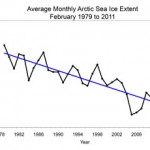
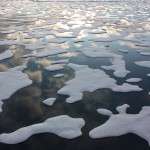
- Sea ice is formed by freezing of sea water in the polar regions. Because it mediates the exchange of energy between the atmosphere and the ocean, sea ice is an important component of the global climate system. When melt ponds form, more energy is absorbed and the effect of global warming is reinforced (ice-albedo feedback). Mathematicians are actively involved in efforts to improve the modeling of sea ice. The graph shows the extent of Arctic sea ice during the period February 1979 until February 2011. The linear rate of decline for January is now 3.2% per decade.
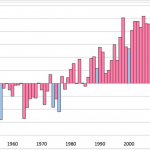
- The graph shows the annual average global surface temperature anomalies since 1950. (The temperature anomaly is the difference between the actual temperature and the average temperature for the period 1950-2010.) The global average surface temperature in 2011 is currently the tenth highest on record and is higher than the global average surface temperature for any previous year with a La Niña event. (A La Niña event has a relative cooling effect. Blue bars indicate years influenced by a La Niña event.) The 13 warmest years have all occurred in the 15 years since 1997. Statistical methods are being developed to quantify the likelihood of extreme events in future years.
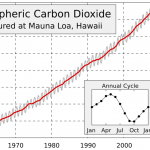
- This is the famous “Keeling Curve,” a graph of the concentration of carbon dioxide (CO2) in the atmosphere on the Mauna Loa Volcano on Hawaii Island. The data come from one of the longest-running observational studies in climate science. The observations were initiated by Charles David Keeling in 1958 and are continuing until this day. The Keeling curve provides the most convincing evidence to date of anthropogenic effects on the Earth’s climate.
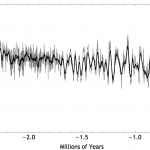
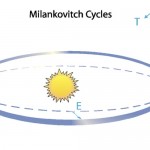
- The Earth’s climate changes over time. This record of he Earth’s global average temperature over the past 3 million years was reconstructed from proxy data (oxygen isotope ratios from deep-sea sediment cores). It shows oscillations with a period of approximately 40 thousand years until about 1 million years before the present and a period of approximately 100 thousand years during the last 1 million years. Explaining the mechanism behind this periodicity and the change in the periodicity are among the major topics of research in climate mathematics.
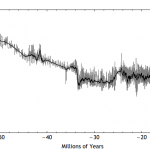
- This graph shows the global average temperature for the past 65 million years. The graph has been reconstructed from “proxy data” that are indicators of climate variability and stand-ins for temperature (e.g., isotope ratios in ice cores, fossil pollen, ocean sediments, and coral data). Because of the diverse sources of proxy data, statistical methods are being used extensively to reconstruct paleoclimate temperature records like the one above.
- This graph shows the global average temperature variation for the past 450 thousand years. (Time runs from right to left.) The pulse of the ice ages can be seen, but the signal appears noisy, with numerous irregular jumps. The mechanism which causes this sequence of pseudo-periodic oscillations in the climate is not well understood and is a topic of active research in climate mathematics.
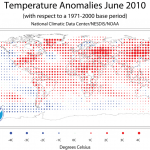
- Not all areas on the Earth’s surface experience the same climate. This picture shows the temperature anomalies observed during the month of June 2010, when Russia suffered one of its worst periods of drought.
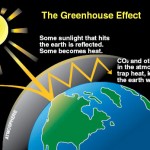
- The Earth’s climate system receives its energy in the form of radiation from the Sun. To maintain equilibrium, the Earth must radiate the energy it receives back into the stratosphere; it does this in the form of infrared radiation. Simple energy balance considerations show that the climate system can have multiple equilibrium states, one of which corresponds to the current climate. If the system is perturbed sufficiently strongly, a tipping point may be reached where the system transits to another equilibrium state. The geological record indicates that such transitions have occurred in the past.
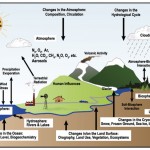
- This cartoon shows the various components of the Earth’s climate system. A climate model is a description of this system in mathematical terms. Climate models are used in computational simulations to explore the behavior of the system under various forcing scenarios.
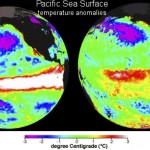
- During an El Nino episode, the trade winds in the central and western Pacific relax, leading to a depression of the thermocline in the eastern Pacific and an elevation of the thermocline in the western Pacific. (The thermocline is the boundary between the warm upper layer of the ocean and the cold deeper part.) The efficiency of upwelling of cold water from deeper levels decreases, and the supply of nutrient-rich thermocline water is cut off. Rainfall follows the warm water eastward, with associated flooding in Peru and drought in Indonesia and Australia. The eastward displacement of the atmospheric heat source overlaying the warmest water results in large changes in the global atmospheric circulation, which in turn force changes in weather in regions far removed from the tropical Pacific. El Nino events occur every 3-7 years and alternate with the opposite phases (La Nina) of below-average temperatures in the eastern tropical Pacific, . The image shows the sea surface temperature anomalies (degrees C) observed under El Nino conditions (December, 1997; left) and La Nina conditions (December, 2002; right).
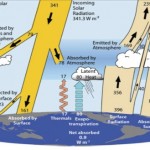
- This cartoon shows the most important mechanisms involved in the energy exchange between the lower atmosphere and the Earth’s surface. An energy balance model is a mathematical description of these various mechanisms. Energy balance models are conceptual models that are used in a system-level approach to explore, for example, the effect of greenhouse gas emissions and other forcing mechanisms on climate.
