Login

Mathematics of Planet Earth

  • Home
  • About MPE
  • Programs
    • Long Term Programs
    • Summer Schools
    • Workshops
    • Meetings
    • Special Sessions
    • Colloquia and Seminars
    • Public Lectures
    • Simons Lectures
  • Education
    • Public Lectures
    • Speakers Bureau
    • Summer Schools
    • Resources
    • Posters
    • Curriculum Materials
    • Academic programs
  • Events
    • MPE Day at UNESCO
    • Public Lectures
    • Exhibitions
    • Competitions
    • Awareness events
  • Partners
    • MPE2013 Partner Reports
    • Societies
    • International Bodies
    • Institutes
    • Research Centers
    • Scientific Journals
    • Teacher Associations
    • Academic
    • Magazines
    • Science Centers
    • Others
    • Becoming a Partner
  • Learn More
    • Books
    • Articles
    • Educational Resources
    • Videos and Podcasts
    • Speakers Bureau
  • Newsroom
  • Blog
  • Calendar
  • Opportunities
  • Français

Climate Data – The Keeling Curve

Published November 16, 2012 at 1075 × 699 in Images
Mauna Loa CO2 Data

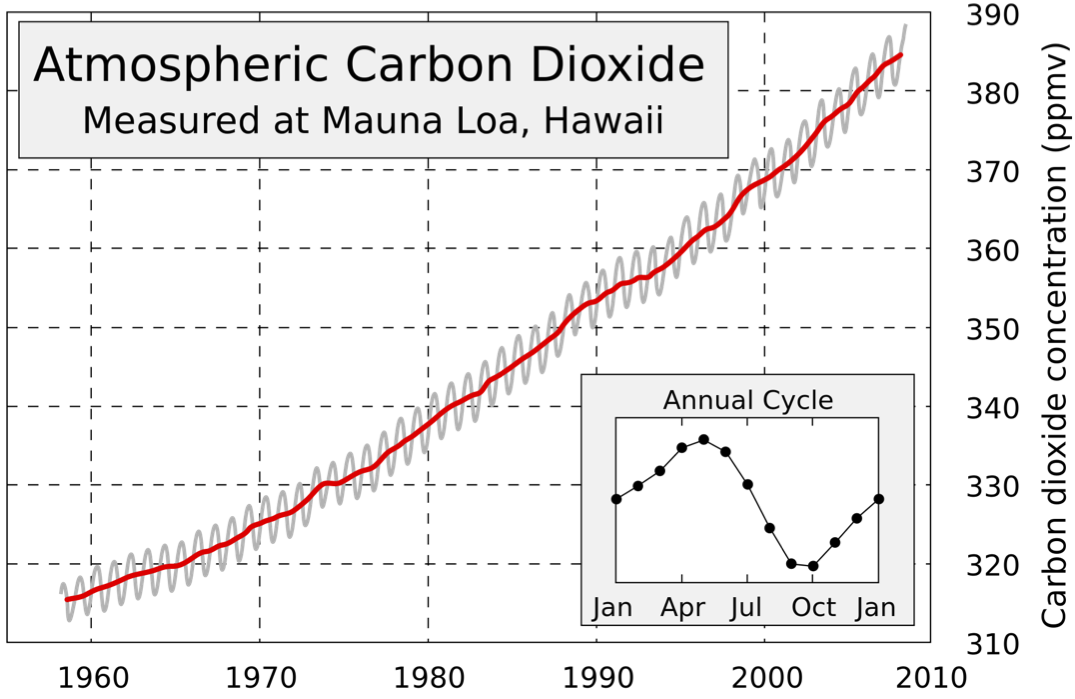
This is the famous “Keeling Curve,” a graph of the concentration of carbon dioxide (CO2) in the atmosphere on the Mauna Loa Volcano on Hawaii Island. The data come from one of the longest-running observational studies in climate science. The observations were initiated by Charles David Keeling in 1958 and are continuing until this day. The Keeling curve provides the most convincing evidence to date of anthropogenic effects on the Earth’s climate.

Image: Wikipedia

  • Contact

IMU UNESCO ICIAM ICSU