Login

Mathematics of Planet Earth

  • Home
  • About MPE
  • Programs
    • Long Term Programs
    • Summer Schools
    • Workshops
    • Meetings
    • Special Sessions
    • Colloquia and Seminars
    • Public Lectures
    • Simons Lectures
  • Education
    • Public Lectures
    • Speakers Bureau
    • Summer Schools
    • Resources
    • Posters
    • Curriculum Materials
    • Academic programs
  • Events
    • MPE Day at UNESCO
    • Public Lectures
    • Exhibitions
    • Competitions
    • Awareness events
  • Partners
    • MPE2013 Partner Reports
    • Societies
    • International Bodies
    • Institutes
    • Research Centers
    • Scientific Journals
    • Teacher Associations
    • Academic
    • Magazines
    • Science Centers
    • Others
    • Becoming a Partner
  • Learn More
    • Books
    • Articles
    • Educational Resources
    • Videos and Podcasts
    • Speakers Bureau
  • Newsroom
  • Blog
  • Calendar
  • Opportunities
  • Français

Climate Data – Global Temperature Anomaly

Published November 16, 2012 at 1500 × 928 in Images

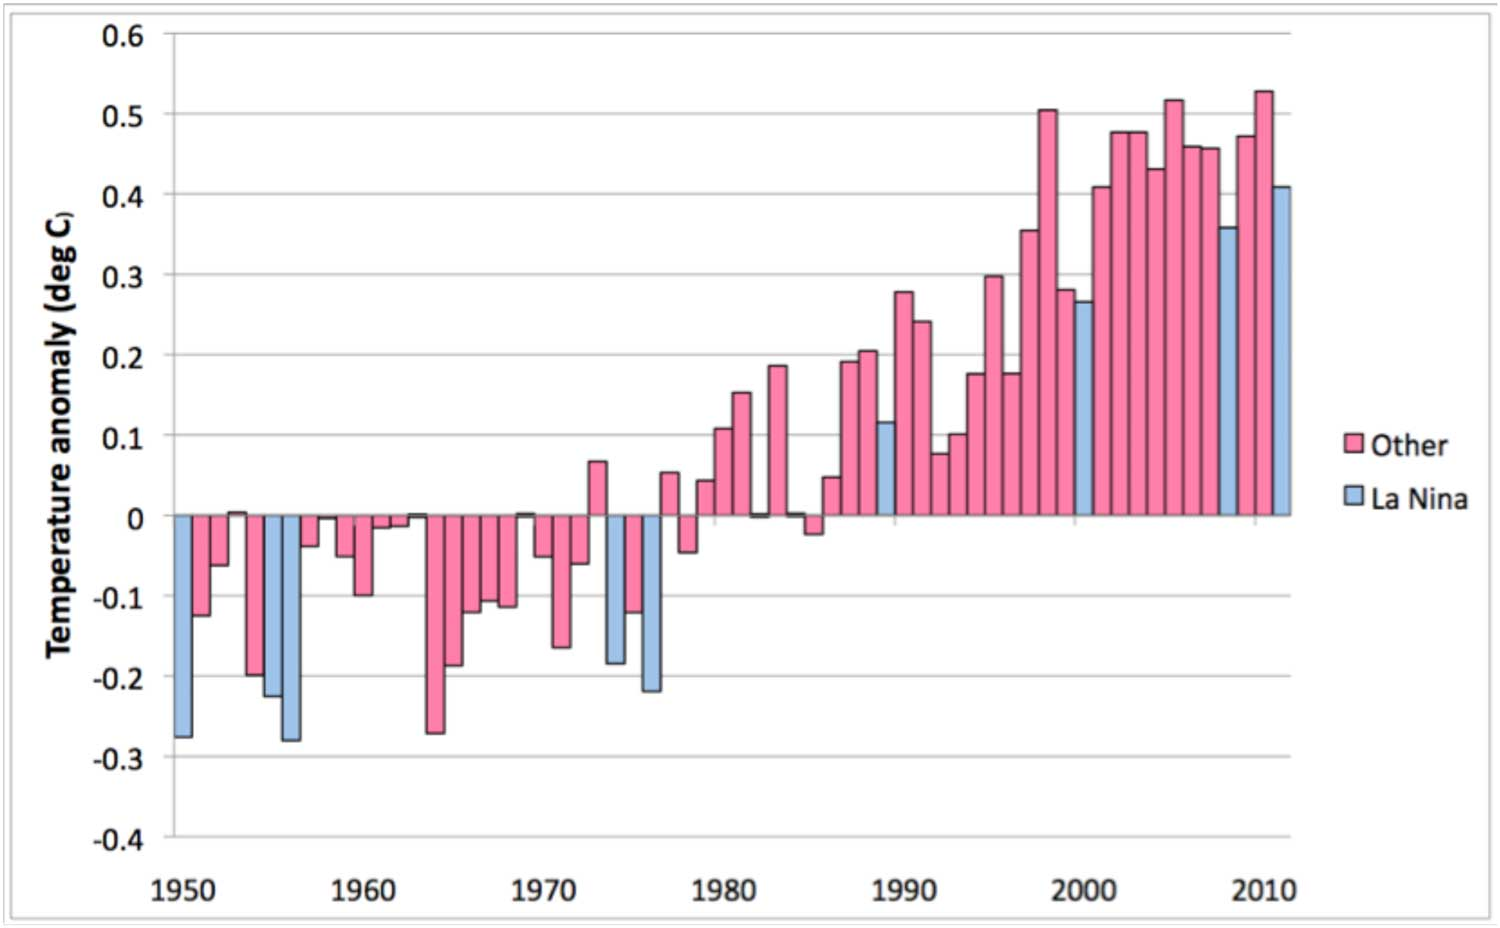
The graph shows the annual average global surface temperature anomalies since 1950. (The temperature anomaly is the difference between the actual temperature and the average temperature for the period 1950-2010.) The global average surface temperature in 2011 is currently the tenth highest on record and is higher than the global average surface temperature for any previous year with a La Niña event. (A La Niña event has a relative cooling effect. Blue bars indicate years influenced by a La Niña event.) The 13 warmest years have all occurred in the 15 years since 1997. Statistical methods are being developed to quantify the likelihood of extreme events in future years.

Image: World Meteorological Organization (WMO)

  • Contact

IMU UNESCO ICIAM ICSU