Login

Mathematics of Planet Earth

  • Home
  • About MPE
  • Programs
    • Long Term Programs
    • Summer Schools
    • Workshops
    • Meetings
    • Special Sessions
    • Colloquia and Seminars
    • Public Lectures
    • Simons Lectures
  • Education
    • Public Lectures
    • Speakers Bureau
    • Summer Schools
    • Resources
    • Posters
    • Curriculum Materials
    • Academic programs
  • Events
    • MPE Day at UNESCO
    • Public Lectures
    • Exhibitions
    • Competitions
    • Awareness events
  • Partners
    • MPE2013 Partner Reports
    • Societies
    • International Bodies
    • Institutes
    • Research Centers
    • Scientific Journals
    • Teacher Associations
    • Academic
    • Magazines
    • Science Centers
    • Others
    • Becoming a Partner
  • Learn More
    • Books
    • Articles
    • Educational Resources
    • Videos and Podcasts
    • Speakers Bureau
  • Newsroom
  • Blog
  • Calendar
  • Opportunities
  • Français

Climate Data – Paleoclimate

Published November 16, 2012 at 1159 × 307 in Images
Temperature Anomaly 450 Kyr

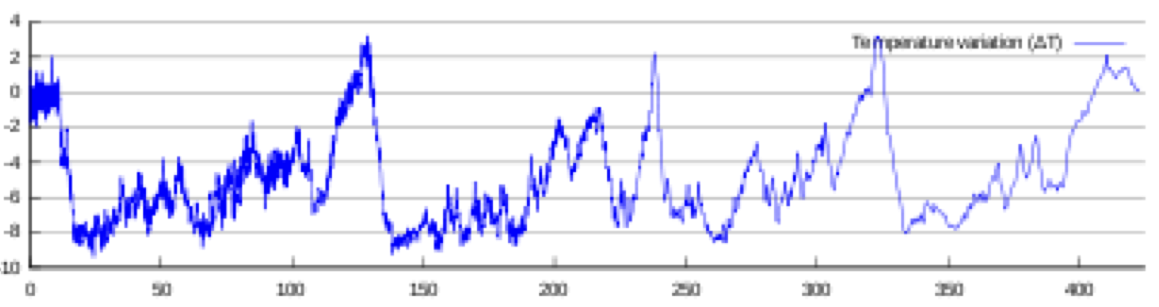
This graph shows the global average temperature variation for the past 450 thousand years. (Time runs from right to left.) The pulse of the ice ages can be seen, but the signal appears noisy, with numerous irregular jumps. The mechanism which causes this sequence of pseudo-periodic oscillations in the climate is not well understood and is a topic of active research in climate mathematics.

Data from ftp://ftp.ncdc.noaa.gov/pub/data/paleo/contributions_by_author/zachos2001/zachos2001.txt

  • Contact

IMU UNESCO ICIAM ICSU