Modern society is increasingly dependent on imaging technology. Medical imaging has become a vital part of healthcare, with X-ray tomography, MRI, and ultrasound being used daily for diagnostics and treatment monitoring of various diseases; meteorological radar predicts weather, sonar scanners produce sea-floor maps, and seismometers aid in geophysical exploration.
In these techniques, the imaged medium is probed by certain physical signals (X-rays, electromagnetic or sound waves, etc.) and the response is recorded by a set of receivers. For example, in computerized tomography (CT), X-rays are sent at various angles through the human body and the intensity of outgoing rays is measured. In ultrasound tomography sound waves are sent through the body and the transducers located on the surface of the body collect the resulting echoes.
Imaging modalities differ in the physical nature of input and output signals, their interaction with the medium, as well as geometric setups of data acquisition. As a result, the mathematical description of the underlying processes and collected data are different, too. However, many of them fall into a common mathematical framework based on integral geometry and the wave equation. In particular, one can model scattered waves (the recorded data) as integrals along certain trajectories of a function that describes physical or biological properties of the medium. In order to create an image of the medium, one would like to recover the latter function from the data, i.e., to invert the integral transform. Integral geometry is a branch of mathematics that studies properties of such transforms and their inversion. For example, in X-ray tomography, the data are essentially integrals of the density of the object over lines.
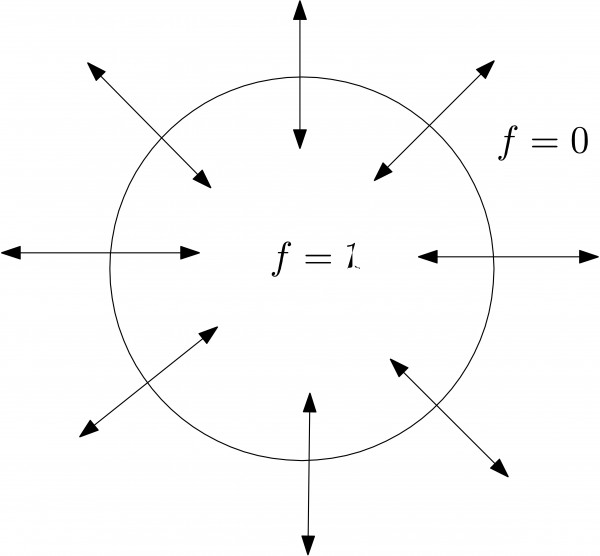
In many imaging applications, recovering the unknown function modeling the medium is not possible—either because the data are complicated or because not enough data are taken to obtain exact reconstruction formulas. In fact, full knowledge of the function is not always necessary. For example, if one is looking for a tumor in a part of the human body, then the location and shape of the tumor are already useful information even if the exact values of the tumor density are not recovered. The location of the tumor can be easily determined from the singular support of the density function of the body, which is the set of points where the function changes values abruptly. For example, the electromagnetic absorption coefficient of a cancerous tissue is far greater than that of a healthy tissue. A better understanding of the tumor regions can be obtained if we can recover the shape of the tumor as well. In other words, more precise information can be had if we can attach certain directions to the singular support at a point. In mathematical terms, such information can be obtained by looking at the Fourier transform of the function. A smooth function that is zero in the complement of any ball has the property that its Fourier transform decays rapidly at infinity; in other words, the decay at any point is faster than any negative power of the distance of that point from the origin. One could then study the local behavior as well as the directional behavior of a function near a singular point by localizing the function near that point and by looking at the directions where its (localized) Fourier transform is not rapidly decaying. Such directions are in the wavefront set of the function. For example, if f is the function that takes the values 1 inside and 0 outside the disk in Figure 1, then the function is not smooth at the boundary circle. The wavefront directions are those normal to the boundary. Intuitively, these are the directions at which the jump in values of f at the boundary is most dramatic. Microlocal analysis is the study of such singularities and what operators (such as those in tomography) do to them.
Figure 1 This picture represents the function that takes the values 1 inside and 0 outside the circle. The wavefront set is the set of normals to the boundary of the disk.
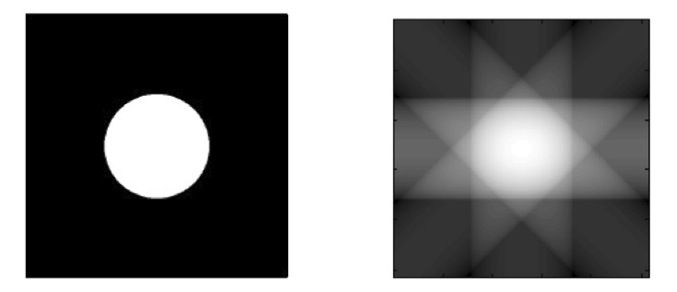
In cases where exact reconstruction formulas are not possible, approximate backprojection reconstruction can be used. Microlocal analysis of such reconstruction operators gives very useful information. Let f be a function and let x be a point one wants to image (i.e.,. find f(x)). The data are integrals of f over lines the X-rays traverse. Figure 2 shows what happens when f is the function that takes the values 1 inside and 0 outside the disk. For each line L in the plane, the data Rf(L) is the length of the intersection of L with the disk. So, Rf(L) is 0 if L does not meet the disk and Rf(L) is the value of the diameter of the circle if L goes through the center of the disk. For such functions g(L) defined on a set of lines one can define a backprojection operator R*, which maps g(L) to a function h(x) as follows. For every fixed x, the value h(x) is equal to the “average” of g(L) over all L passing through x. Now, applying R* to Rf one obtains the so-called normal operator of f, which is often used as an “approximate reconstruction operator” of f, i.e., h(x)=R*Rf(x) is an approximation to f. The study of normal operators and how well h(x) approximates f(x) in a given setup is one of the important problems in integral geometry. Ideally, one would like to have a situation when the wavefront set of h is the same as that of f. In this case, the singularities of the reconstruction, h, would be in the same locations as f. However, in many cases h may have some additional singularities (artifacts) or lack some of the singularities of f. One of the goals in such cases is to describe these artifacts, find their strengths, and diminish them as much as possible.
Figure 2 A disk and the backprojection reconstruction from X-ray data. The lines in the data set are horizontal and vertical and lines at 45 and 135 degrees. Note how the reconstruction “backprojects” the values of the line integrals over all points in the line. Then, these are added up to get the reconstruction. With lines in more angles, the reconstruction will look much better.
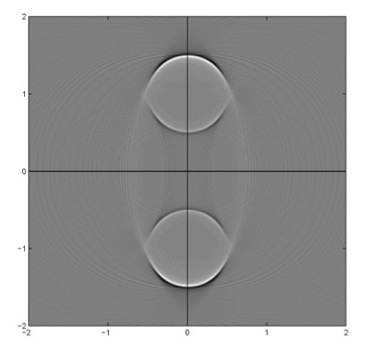
Similar problems arise for transforms integrating along other types of curves, for example the transform R that integrates over ellipses with foci on the x-axis. This elliptical transform is related to the model of bistatic radar [4]. In this case, the reconstruction operator includes a backprojection plus a sharpening algorithm. The ellipses have foci in the interval [-3,3] along the x-axis. The function to be reconstructed is the characteristic function of a disk above the x-axis. Two important limitations of backprojection reconstruction methods are visible in this reconstruction. First, the top and bottom of the disk are visible but the sides are not. Second, there is a copy of the disk below the x-axis, although the object is above the axis. This is to be expected because the ellipses are all symmetric with respect to the x-axis—an object above the axis would give the same data as its mirror image below the axis.
Figure 3 Reconstruction of a disk on the y-axis from integrals over ellipses centered on the x-axis and with foci in [-3,3]. Notice that some boundaries of the disk are missing. There is a copy of the disk below the axis [Howard Levinson, Senior Honors Thesis, Tufts University, 2011].
This same left-right ambiguity happens in synthetic aperture radar [5] [7], and it is important to understand the nature of the artifacts and why they appear. As can be seen in Figure 3, there is an artifact below the flight path. The artifact is as pronounced as the original disk, and microlocal analysis shows that such artifacts will always be as strong as the original object (e.g., [1]). However, if the flight path is not straight, microlocal analysis shows that the artifacts change position, and in certain cases, some artifacts can be eliminated [2, 6]. This problem comes up in other areas, such as electron microscopy and SPECT [3].
REFERENCES
[1] G. Ambartsoumian, R. Felea, V. Krishnan, C. Nolan, and E.T. Quinto, A class of singular Fourier integral operators in synthetic aperture radar imaging, Journal of Functional Analysis, 264 (2013), 246-269.
[2] R. Felea, Displacement of artifacts in inverse scattering, Inverse Problems 23 (2007) 1519–1531.
[3] R. Felea and E.T. Quinto, The microlocal properties of the local 3-D SPECT operator, SIAM J. Math Anal., 43 (2011), 1145–1157.
[4] V. Krishnan and E.T. Quinto, Microlocal aspects of bistatic synthetic aperture radar imaging, Inverse Problems and Imaging, 5 (2011), 659-674.
[5] C.J. Nolan and M. Cheney, Microlocal analysis of synthetic aperture radar imaging. J. Fourier Anal. Appl., 10(2) (2004), 133–148.
[6] P. Stefanov and G. Uhlmann, Is a curved flight path in SAR better than a straight one?, SIAM J. Appl. Math., 2013, to appear.
[7] L. Wang, C. E. Yarman, B. Yazici, “Theory of Passive Synthetic Aperture Imaging,” in Excursions in Harmonic Analysis, Volume 1, Springer-Birkhauser Applied and Numerical Harmonic Analysis (ANHA) book series, Editors: T.D. Andrews.; R. Balan; J.J. Benedetto; W. Czaja; K.A. Okoudjou; 2013, XI, 519 p., ISBN 978-0-8176-8375-7.
Gaik Ambartsoumian, University of Texas, Arlington, TX
Raluca Felea, Rochester Institute of Technology, NY
Venky Krishnan, Tata Institute of Fundamental Research Centre for Applicable Mathematics, Bangalore, India
Cliff Nolan, University of Limerick, Ireland
Todd Quinto, Tufts University, Medford, MA


