Weather extremes capture the public’s attention and are often used as arguments in the debate about climate change. In daily life, the term extreme event can refer, for example, to an event whose intensity exceeds expectations, or an event with high impact, or an event that is rare or even unprecedented in the historical record. Some of these notions may hit the mark, but they need to be quantified if we want to make them useful for a rational discussion of climate change. The concern that extreme events may be changing in frequency and intensity as a result of human influences on climate is real, but the notion of extreme events depends to a large degree on the system under consideration, including its vulnerability, resiliency, and capacity for adaptation and mitigation.
Since extreme events play such an important role in the current discussion of climate change, it is important that we get their statistics right. The assessment of extremes must be based on long-term observational records and a statistical model of the particular weather or climate element under consideration. The proper framework for their study is probability theory—an important topic of mathematics. The recent special report on managing the risks of extreme events (SREX) prepared by the IPCC describes an extreme event as the “occurrence of a value of a weather or climate variable above (or below) a threshold value near the upper (or lower) ends of the range of observed values of the variable.” Normally, the threshold is put at the 10th or 90th percentile of the observed probability distribution function, but other choices of the thresholds may be appropriate given the particular circumstances.
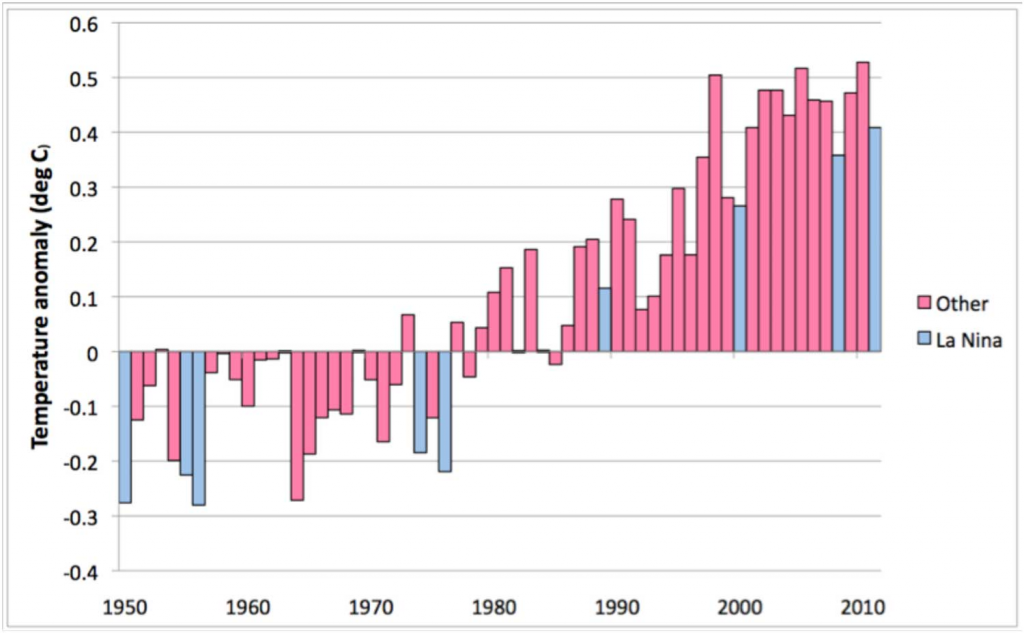
When discussing extreme events, it is generally better to use anomalies, rather than absolutes. Anomalies more accurately describe climate variability and give a frame of reference that allows more meaningful comparisons between locations and more accurate calculations of trends. Consider, for example, the global average temperature of the Earth’s surface. We have a fairly reliable record going back to 1880, but rather than looking at the temperature itself, we use the temperature anomaly to study extremes. The figure shows the global temperature anomaly since 1950 relative to the average of these mean temperatures for the period 1961-1990.

Global temperature anomaly from 1950 to 2011 relative to the base period 1961–1990. (Reprinted with permission from World Meteorological Organization (WMO).)
We see that the year 2010 tied with 2005 as the warmest year on record. The year 2011 was somewhat cooler, largely because it was a La Niña year; however, it was the warmest La Niña year in recent history.
While the global mean temperature for the year 2010 does not appear much different from previous years, exceeding the 1961-1990 average by only about $0.5^\mathrm{o}$C, the average June temperature exceeded the corresponding 1971-2000 average by up to $5^\mathrm{o}$C in certain regions, and the same year brought heat waves in North America, western Europe, and Russia. Observed temperature anomalies were, in fact, much higher during certain months in certain regions and it is likely that these extremes were even more pronounced at individual weather stations.
Since localized extremes cause disruptions of the socioeconomic order, from crop failures to forest fires and excess deaths, they are of considerable interest to the public. To assess the likelihood of their occurrence, we need both access to data and rigorous statistical analysis. Until recently, reliable data have been scarce for many parts of the globe, but they are becoming more widely available, allowing research of extreme events on both global and regional scales. The emphasis shifts thereby from understanding climate models to assessing the likelihood of possibly catastrophic events and predicting their consequences. For what kind of extreme events do we have to prepare? How often do these extremes occur in a stationary climate? What magnitudes can they have? And how does climate change figure in all this?
Adapted from the forthcoming book “Mathematics and Climate” by Hans Kaper and Hans Engler; SIAM, Philadelphia, Pennsylvania, USA (OT131, October 2013).
Pingback: Climate Science without Climate Models | Mathematics of Planet Earth 2013