Tuesday April 9, 2013
(High of 65 — felt like 72 or so — and winds at 25mph, gusting
to 33mph. Record high for Worcester on April 9 is 77.)
It was unusually warm and windy for early April. We piled into the toasty lecture hall with drinks and sandwich wraps in hand. Dr. Smith, with his shock of white hair and the thin frame of a marathon runner, shed his sport jacket as he recounted the 2003 European heat wave which some claim to have caused up to 70,000 deaths; the 2010 Russian heatwave; the floods in Pakistan that same year; and the devastation Hurricane Sandy last year.
Trained as a probabilist and currently the Director of SAMSI and a professor of Statistics at UNC Chapel Hill, Richard Smith guided the audience through the challenges of doing reliable science in the study of climate change. Rather than address the popular question of whether recent climate anomalies are out of the statistical norm of recent millenia (and other research strongly suggests they are), Dr. Smith asked how much of the damage is attributable to human behaviors such as the emission of greenhouse gases from the burning of fossil fuels.
Demonstrating a deep familiarity with the global debate on climate change and the reports of the IPCC (Intergovernmental Panel on Climate Change), Professor Smith discussed the statistical parameter “fraction of attributable risk” (FAR), which is designed to compare the likelihood of some extreme weather event (such as a repeat of the European heat wave) under a model that includes anthropogenic effects versus the same value ignoring human factors.
Employing the rather flexible Generalized Extreme Value Distribution (GEV) and Bayesian Hierarchical Modeling, Dr. Smith walked the audience of 40+ through an analysis of the sample events mentioned above, giving statistically sound estimates of how likely an event is to occur given anthropogenic effects versus without them. Smith explained how a strong training in statistics guides one to the choice of the GEV distribution as a natural model for such events; this distribution involves a parameter xi which allows us to accurately capture the length of the tail of our observed distribution.
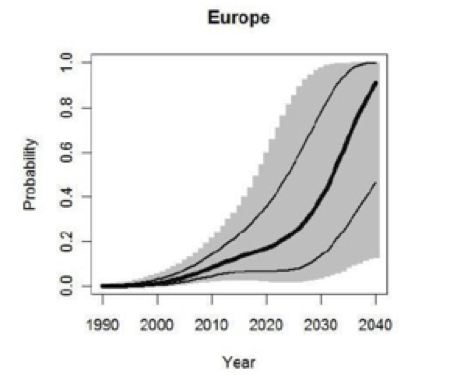
Perhaps the most compelling graphs were plots of the estimated changes in predicted extreme weather events over time. One such plot is included below, giving the probability of a repeat of an event in Europe similar to the 2003 heat wave, with posterior median and quartiles marked in bold and a substantial confidence interval shaded on the plot.
One intriguing aspect of this cleverly designed talk was a digression about computational climate models. The NCAR Wyoming Supercomputing Center in Cheyenne, houses the notorious “Yellowstone” with its 1.5 petaflop capabilities and 144.6 terabyte storage farm, which will cut down the time for climate calculations and provide much more detailed models (reducing the basic spacial unit from 60 square miles down to a mere 7). Dr. Smith explained the challenge of obtaining and leveraging big data sets and amassing as many reliable runs of such climate simulations as possible to improve the reliability of the corresponding risk estimates. The diverse audience encountered a broad range of tools and issues that come into play in the science of climate modeling, and we all had a lot to chew on as a result of this talk.
A lively question and answer period ensued with questions about methodology, policy, volcanoes versus vehicles, and where to go from here to make a difference. Then we all poured out into the heat of an extremely warm April afternoon, pondering whether this odd heat and wind was normal for a spring day in Massachusetts.
Dr. William J Martin,
Professor, Mathematical Sciences and Computer Science
WPI
