[Adapted from Chapter 11 of the forthcoming text Mathematics and Climate, by Hans G. Kaper and Hans Engler, to be published by the Society for Industrial and Applied Mathematics (SIAM), 2013.]
In 1941, the Serbian mathematician Milutin Milankovitch (1879–1958) suggested that past glacial cycles might be correlated to cyclical changes in the insolation (the amount of solar energy that reaches Earth from the Sun) [M. Milankovitch, Kanon der Erdbestrahlung und seine Anwendung auf das Eiszeitenproblem, University of Belgrade, 1941]. This theory is known as the Milankovitch theory of glacial cycles and is an integral part of paleoclimatology (the study of prehistoric climates). It has been discussed in an earlier post on paleoclimate models by Christiane Rousseau.
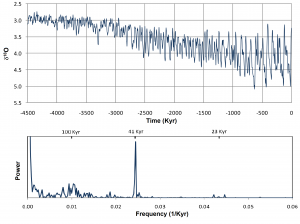
The theoretical results obtained for the Milankovitch cycles can be tested against temperature data from the paleoclimate record. In the 1970s, Hayes et al. [Variations in the Earth’s orbit: Pacemaker of the ice ages, Science, 194 (1976), 1121–1132] used data from ocean sediment core samples to relate the Milankovitch cycles to the climate of the last 468,000 years. One of their conclusions was that “. . . climatic variance of these records is concentrated in three discrete spectral peaks at periods of 23,000, 42,000, and approximately 100,000 years.” This study was repeated recently by Zachos et al. [Trends, rhythms, and aberrations in global climate 65 Ma to present, Science, 292 (2001), 686–693], who used much more extensive data. The reconstructed temperature profile and the corresponding power spectrum show periods of 100, 41, and 23 Kyr, see Figure 1.
The best data we have for temperatures during the ice age cycles come from the analysis of isotope ratios of air trapped in pockets in the polar ice. The ratio of oxygen isotopes is a good proxy for global mean temperature. In the 1990s, Petit et al. [Climate and atmospheric history of the past 420,000 years from the Vostok ice core, Antarctica, Nature, 399 (1999), 429–436] studied data from the Vostok ice core to reconstruct a temperature profile for the past 420,000 years. Although the record is only half a million years long, it allows for fairly precise dating from the progressive layering process that laid down the ice. A spectral analysis shows cycles with periods of 100, 43, 24, and 19 Kyr, in reasonable agreement with previous findings and with the calculated periods of the Milankovitch cycles.
At this point we might conclude that Milankovitch’s idea was correct and that ice ages are indeed correlated with orbital variations. There are, however, some serious caveats. Changes in the oxygen isotope ratio reflect the combined effect of changes in global ice volume and temperature at the time of deposition of the material, and the two effects cannot be separated easily. Furthermore, the cycles do not change the total energy received by the Earth if this is averaged over the course of a year. An increase in eccentricity, or obliquity, means the insolation is larger during part of the year and smaller during the rest of the year, with very little net effect on the total energy received at any latitude over a year. However, a change in eccentricity or obliquity could make the seasonal cycle more severe and thus change the extent of the ice caps. A possible scenario for the onset of ice ages would then be that minima in high-latitude insolation during the summer enable winter snowfall to persist throughout the year and thus accumulate to build glacial ice sheets. Similarly, times with especially intense high-latitude summer insolation could trigger a deglaciation. Clearly, additional detailed modeling would be needed to account for these effects.
Even allowing for the scenario described in the previous paragraph, we would expect an asymmetric climate change, where the ice cap over one of the poles increases while the cap over the other decreases. Yet, the entire globe cooled during the ice ages and warmed during periods of deglaciation.
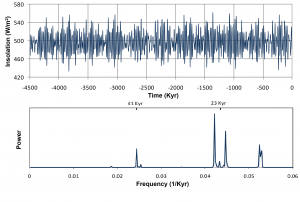
An even more disturbing observation arises when one considers not just the periods of the cycles but also their relative strengths. In the data, the relative contributions are ordered as obliquity, followed by eccentricity, followed by precession, while for the average daily insolation at 65 degrees North latitude at the summer solstice (denoted Q65, shown in Figure 2), the order is the reverse: precession, followed by obliquity, followed by eccentricity. The dominance of precession in the forcing term Q65 does not even show up in the data (the “100,000-year problem”).

Figure 2: Time series and power spectrum of the average daily insolation at 65 degrees North at summer solstice (Q65).
The lesson learned here is that actual climate dynamics are very complex, involving much more than insolation and certainly much more than insolation distilled down to a single quantity, Q65. Feedback mechanisms are at work that are hard to model or explain. On the other hand, an analysis of the existing signals shows that astronomical factors most likely play a role in the Earth’s long-term climate.
